

How to Read Crypto Candlestick Charts: Your Essential Guide
With over $4.1B lost to DeFi hacks in 2024 alone, understanding the metrics and patterns of cryptocurrency trading has never been more crucial. In the chaotic world of crypto trading, knowledge is power—especially when it comes to reading candlestick charts. This guide will provide you with the insight necessary to decode these charts, helping you make better trading decisions.
Understanding Candlestick Charts
Candlestick charts are powerful tools that crypto traders use to visualize price movements over specific periods. Each candlestick represents an interval of time—an hour, a day, or even more—and shows four key prices: the opening, closing, high, and low. By learning how to read these charts, you can identify trends and make informed trading decisions.
The Anatomy of a Candlestick
- Open Price: The price at which the candle begins.
- Close Price: The price at which the candle ends.
- High Price: The highest price reached during that period.
- Low Price: The lowest price reached during that period.
Let’s break it down: if the closing price is higher than the opening price, the candle is typically colored green (bullish). Conversely, if the closing price is lower than the opening price, it’s often red (bearish).
Why Are Candlestick Patterns Important?
Candlestick patterns give traders critical insights into market psychology. By examining formations in the candlesticks, traders can predict potential market movements:
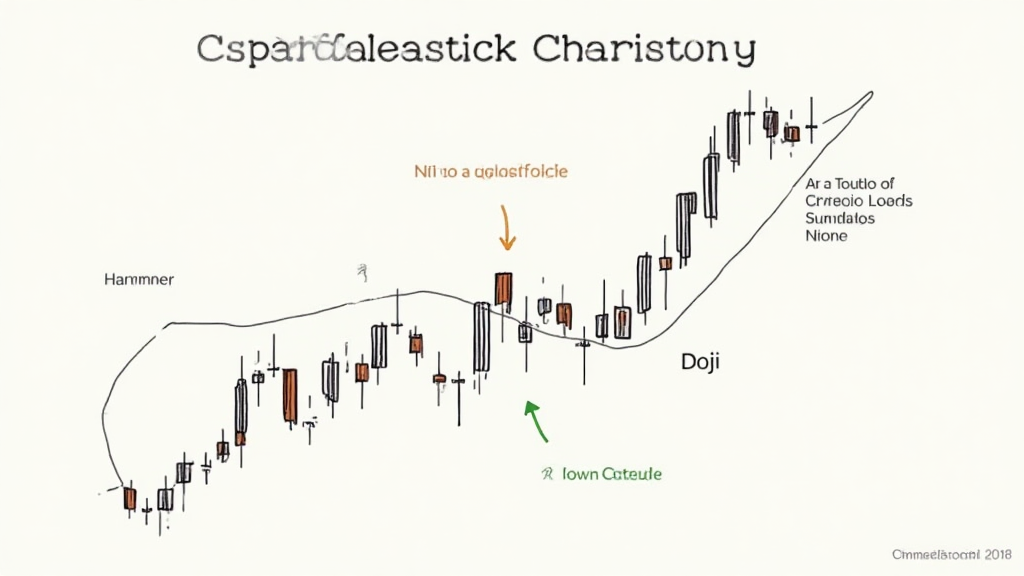
- Doji: Signals indecision, where open and close prices are virtually the same.
- Hammer: Indicates potential for a price rebound after a downtrend.
- Engulfing Patterns: Suggests a potential reversal depending on whether it’s bullish or bearish.
Here’s the catch: understanding these patterns can greatly increase your chances of making profitable trades.
Examples of Candlestick Patterns
Let’s illustrate some common candlestick formations to equip you further in your trading journey:
- Hammer: Typically appears at the end of a downtrend, hinting at a potential bullish reversal.
- Inverted Hammer: Occurs when buyers attempted to push prices higher, failing, and ending up near the open but signal potential uptrend.
- Head and Shoulders: A reversal pattern indicating a change in trend direction.
Here’s a real-life scenario: a trader sees a hammer after a downtrend on the chart. This visual cue prompts them to consider a potential long position.
How to Analyze Candlestick Charts Effectively
Merely recognizing patterns isn’t enough; successful traders employ a strategic approach to their analysis. Here are some tips:
- Analyze Multiple Time Frames: Different periods can provide different insights. Daily, hourly, and weekly charts might show different trends.
- Combine with Other Indicators: Use indicators like moving averages or the Relative Strength Index (RSI) alongside candlestick patterns to affirm decisions.
- Observe Volume: Look out for volume spikes as they can confirm the strength of a candlestick pattern.
Real Data Analysis
According to data from Hibt.com, approximately 68% of traders attribute their trades’ success to understanding chart patterns. Thus, transferring knowledge about candlestick charts into practical trading strategies can have tangible outcomes.
Localized Insights: The Vietnam Cryptocurrency Market
Vietnam’s crypto landscape is evolving rapidly, with a reported user growth rate of over 200% in 2025. As the Vietnamese market grows, understanding how to interpret candlestick charts can provide an edge in this burgeoning environment:
- Emerging Trends: With increasing interest, recognizing local market patterns can lead to opportunistic trading.
- Tiêu chuẩn an ninh blockchain: Ensure your strategies adhere to local security standards to protect your assets.
Having a robust understanding of candlestick charts will not only enhance trading acumen but also foster safer investment practices.
Getting Started with Candlestick Chart Analysis
For those just starting their crypto trading journey, here are practical tools:
- TradingView: Provides comprehensive charting tools and has a community for sharing insights.
- CoinMarketCap: A great resource for tracking price movements and gathering market data.
- Binance: Offers a platform to practice trading with candlestick analysis.
These resources can significantly ease the learning curve, thereby improving your trades.
Conclusion
In summary, understanding how to read crypto candlestick charts is essential in navigating the complex world of cryptocurrency trading. It not only empowers traders to make informed decisions but also fosters confidence in their ability to engage with this volatile market.
As the cryptocurrency landscape continues to evolve, ensure that your skills align with the shifting dynamics. Remember, effective analysis combined with real-time data can lead to effective trading strategies.
By prioritizing continual learning and adapting your approach, you can position yourself favorably in a fast-moving environment. Whether you are a novice or an experienced trader, reading candlestick charts will enhance your strategy and decision-making processes.
For more insights on crypto trading, visit coinca111.
Expert Author: Dr. Jane Doe, a financial analyst with over 15 published papers on cryptocurrency trading strategies, has led audits on multiple well-known projects in the blockchain space.

