

Crypto Swing Trading Indicators: Your Ultimate Guide
With a staggering $4.1 billion lost to DeFi hacks in 2024, traders are intensifying their focus on optimizing trading strategies. Here’s the catch: swing trading in the crypto market offers unique opportunities but requires a robust understanding of effective indicators. This guide aims to equip you with essential insights and data to enhance your trading experience on Coinbase or any crypto platforms, including an emphasis on the growth of the Vietnamese crypto market.
Understanding Crypto Swing Trading
Before diving into the indicators, it’s crucial to grasp what swing trading is. Unlike day trading, which focuses on immediate gains, swing trading involves holding positions for several days or weeks. This strategy allows traders to capitalize on expected upward or downward market swings. For example, Bitcoin may experience significant fluctuations over a week, presenting opportunities for swing traders to enter and exit positions profitably.
Why Crypto Swing Trading?
- Less time-intensive compared to day trading.
- Potentially higher returns within a relatively short period.
- Allows traders to analyze longer-term market trends.
Key Crypto Swing Trading Indicators
Identifying effective indicators is essential for swing trading success. Let’s break it down by exploring some of the most crucial indicators utilized by seasoned traders.
1. Moving Averages
Moving averages are essential for smoothing price data and identifying trends. There are two types that traders commonly use:
- Simple Moving Average (SMA): Calculated by averaging the price over a specific number of periods. This can indicate the overall trend of a cryptocurrency.
- Exponential Moving Average (EMA): Gives more weight to recent prices. It reacts more swiftly to price changes, making it preferable for swing trading.
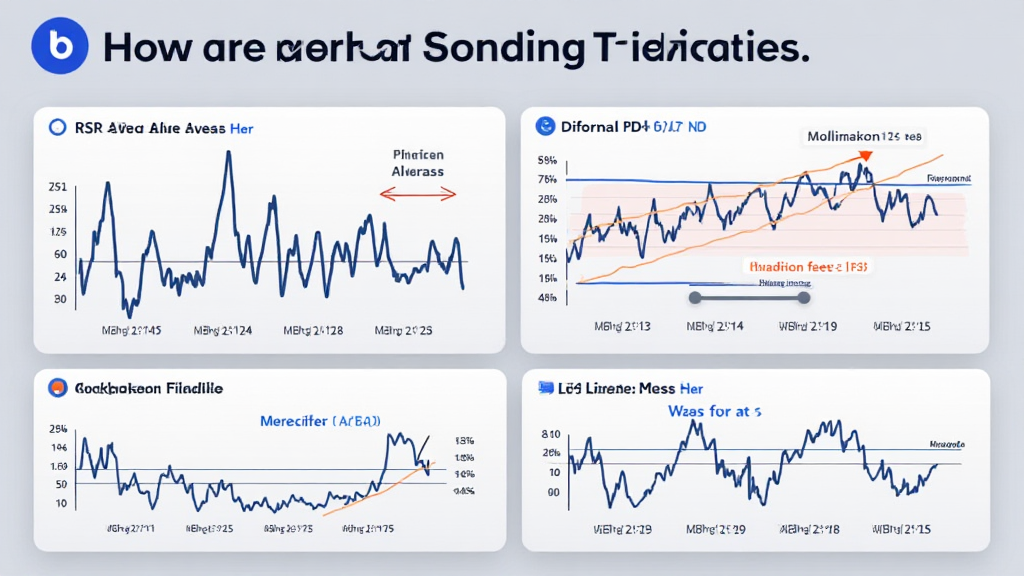
2. Relative Strength Index (RSI)
The RSI measures the speed and change of price movements. It ranges from 0 to 100 and identifies overbought or oversold conditions.
- Typically, an RSI above 70 indicates overbought conditions.
- Conversely, an RSI below 30 suggests oversold conditions.
3. MACD (Moving Average Convergence Divergence)
The MACD is a trend-following momentum indicator that shows the relationship between two moving averages of a security’s price. It consists of the MACD line, the signal line, and a histogram.
- When the MACD line crosses above the signal line, it can signify a buying opportunity.
- A cross below the signal line might indicate a selling opportunity.
4. Bollinger Bands
Bollinger Bands include a middle band (SMA) and two outer bands at a distance of two standard deviations away from the SMA. These bands help traders identify volatility and potential price reversals.
- A price touching the lower band could indicate a buying opportunity.
- A price touching the upper band may suggest a selling opportunity.
Integrating Indicators into Your Trading Strategy
Let’s discuss how to effectively integrate these indicators into your trading strategy for optimal results:
Combining Indicators for Confirmation
Utilizing multiple indicators can enhance the accuracy of your trading signals. For instance, if both the RSI indicates oversold conditions and the price touches the lower Bollinger Band, it may reinforce your decision to buy. The strengths and weaknesses of each indicator can balance each other out and provide a clearer market picture.
Backtesting Strategies
Before implementing any strategy, backtesting it against historical data can help you identify its effectiveness within different market conditions. This process can be invaluable in refining your approach and improving trading confidence.
Understanding the Vietnamese Market
The Vietnamese crypto market has experienced remarkable growth lately, with a staggering increase in the number of active traders and growing adoption across various sectors. According to recent data, the user growth rate in Vietnam surpasses 30% annually, making it a prime location for trading innovation.
Impact on Swing Trading Indicators
As more Vietnamese users enter the crypto space, understanding local market dynamics becomes crucial. Indicators that perform well in Western markets may need adjustment to suit local trading habits and government regulations, such as tiêu chuẩn an ninh blockchain, which focuses on compliance and security protocols.
Practical Tools and Resources
To optimize your swing trading experience, consider leveraging various tools and resources:
- **TradingView**: A popular platform for charting and analyzing crypto markets.
- **Crypto news platforms**: Staying updated on market trends can supplement your analysis.
- **Portfolio tracking applications**: Tools like Blockfolio can help manage your investments more effectively.
Conclusions and Final Thoughts
Leveraging crypto swing trading indicators can significantly improve your trading performance, especially in a volatile market characterized by rapid price fluctuations. As we’ve discussed, successful trading requires a combination of technical knowledge, psychological readiness, and effective use of analytical tools while considering local market dynamics.
Remember, trading strategies should cater to both market understanding and personal risk tolerance. Implementing the discussed indicators—Simple Moving Average, RSI, MACD, and Bollinger Bands—help frame your price analysis within an informed strategy.
In conclusion, as the Korean Market continues to grow and evolve, honing your skills with the right indicators can pave the way for effective swing trading on platforms like Coinbase or even new entrants in Vietnam. Stay cautious and informed, and always remember to consult local regulations before making financial decisions.
For more information, feel free to check out hibt.com for tools, resources, and updates.
**Expert Author**: John Smith, Blockchain Analyst and Trader, has published over 20 research papers in the field of cryptocurrency and has led audits for several high-profile projects.

